Case Study
The Real Problem Wasn't Acquisition — It Was Activation
Data audit and product analytics for an AI-powered bar exam prep platform
Context
The Client
- —AI-powered bar exam prep platform with daily quizzes, practice exams, social features, and gamification
- —Freemium model: free trial → monthly or lifetime subscription
- —Growing user base with significant paid acquisition spend
Problem
What Was Missing
“We have the events. We just don't know what they're telling us.”
- —No data quality validation — dev/staging traffic mixed in
- —No onboarding funnel analysis
- —No engagement segmentation or activity tiers
- —No trial-to-paid conversion tracking
- —No retention or stickiness metrics
- —No feature adoption visibility
Phase 1
The Data Audit
When working with new clients with an existing PostHog implementation, it's always a good idea to start with a comprehensive data audit. I created data audit dashboard that maps every event, every user property, and every data source — surfacing issues that would silently corrupt any analysis built on top.
17
Data audit insights
~20%
Events from non-production
30+
Custom events mapped
11
User properties catalogued
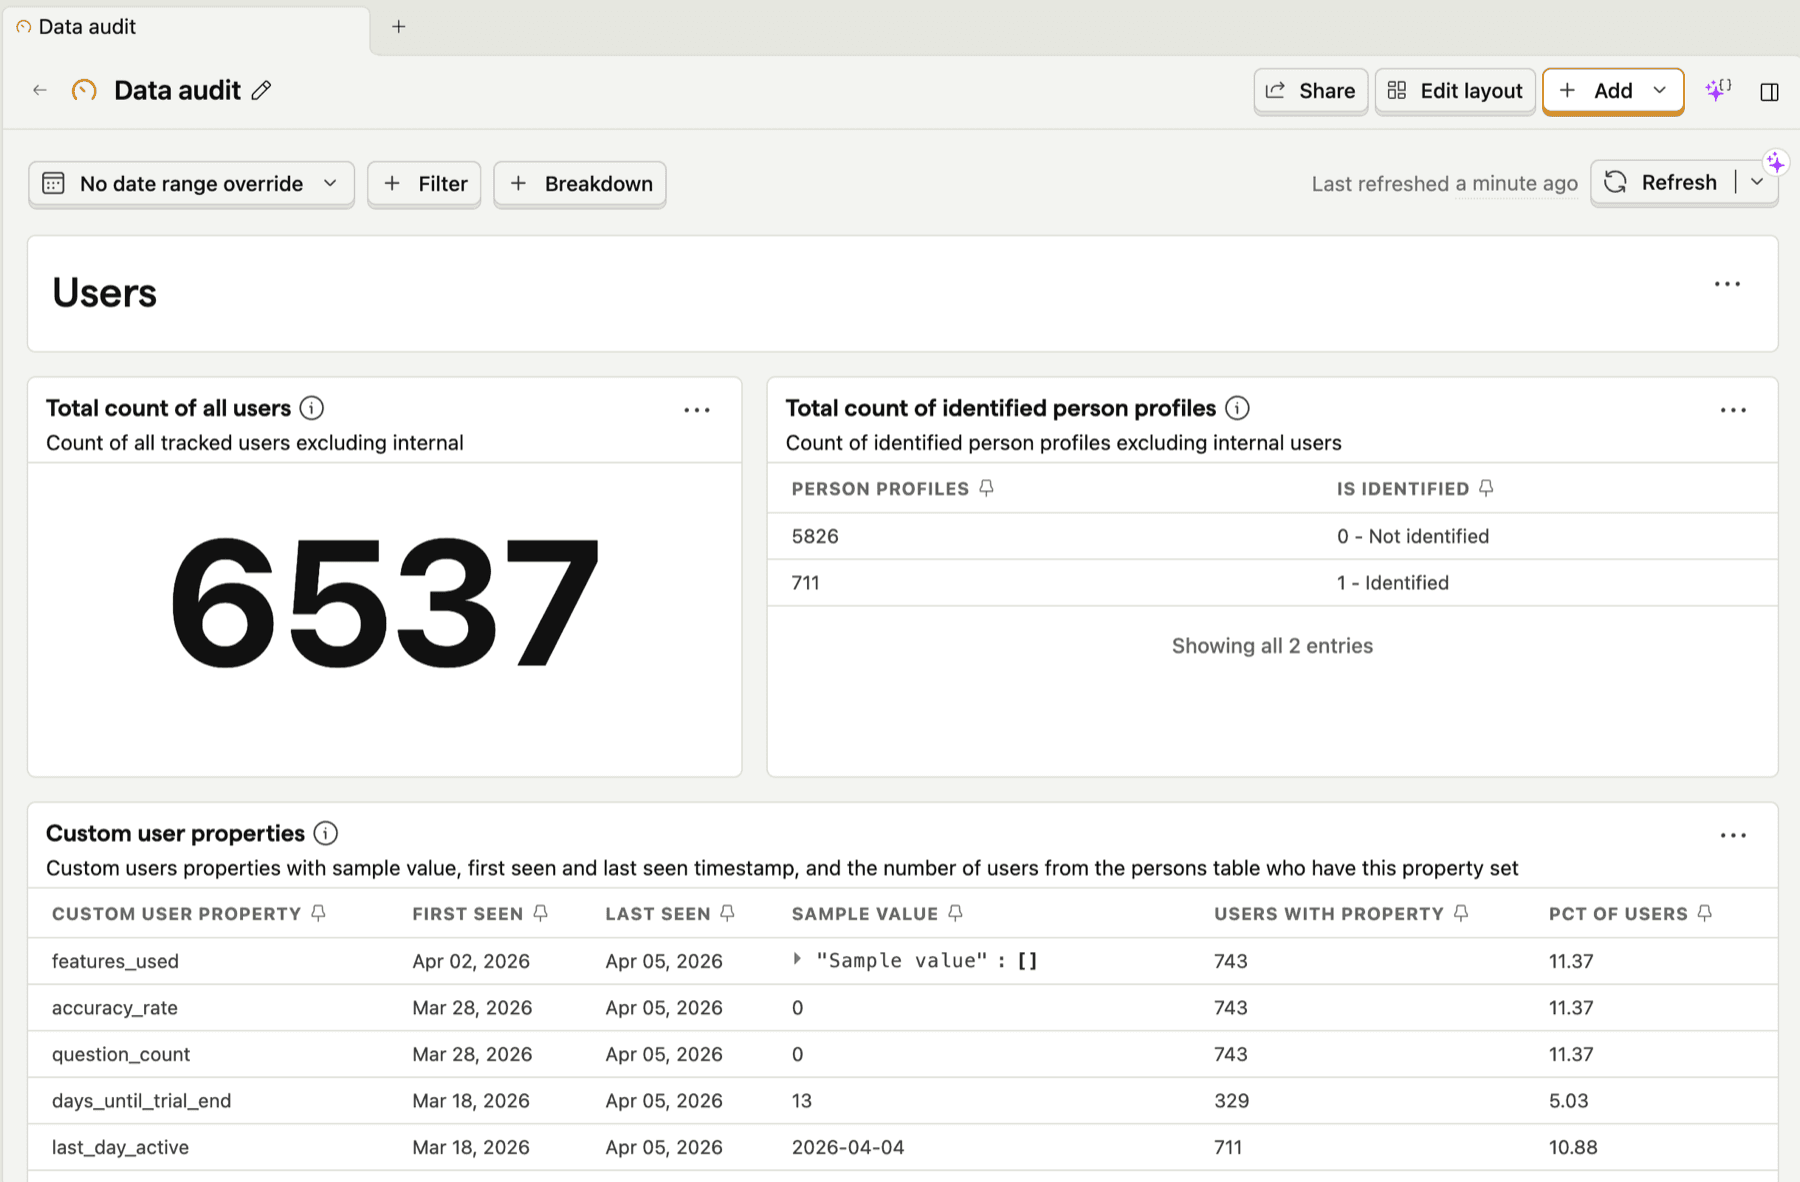
The data audit dashboard — mapping users, events, and data sources before building any analytics
Phase 2
The Product Analytics Dashboard
A 34-chart full-funnel dashboard covering every stage of the user journey — with actionable guidance written into every chart description.
2
Acquisition
11
Activation
12
Engagement
6
Monetisation
2
Retention
1
Support
Finding 1
Two-Thirds of Trial Users Never Engage
The engagement segmentation chart split all trial users by study activity in the last 30 days. The result was stark.
Trial User Engagement (last 30 days)
413
Inactive trial users
29
High-engagement users
34
Active paying subscribers
Finding 2
The Onboarding Funnel Has a Cliff
The onboarding funnel with optional steps revealed where users drop out of the first-session experience.
Finding 3
The Monetisation Gap
The subscription status breakdown told the revenue story at a glance:
| Status | Users | Implication |
|---|---|---|
| No status / never trialed | 5,759 | Visitors who never converted to trial |
| Paused | 580 | Tried, stopped — re-engagement opportunity |
| Trialing | 129 | Currently in free trial |
| Active (paying) | 34 | Revenue-generating users |
Actions
What We Recommended
- 1
Fix the first-session experience
70% of users never start a quiz. Test making the first quiz mandatory during onboarding instead of optional
- 2
Add day-3 and day-7 re-engagement nudges
Week-1 is when habits form or break. Push notifications or emails at these critical moments
- 3
Target the 580 paused users
These users already know the product. A re-engagement campaign (discount, new features) is cheaper than acquiring new users
- 4
Instrument the trial expiry banner conversion
The dashboard tracks banner clicks but not the upgrade flow that follows. Close the measurement gap
- 5
Filter non-production traffic at the source
Configure PostHog to drop staging/localhost events before they enter the pipeline, not after
Impact
What This Engagement Delivered
Before
- —Dev/staging traffic inflating every metric by ~20%
- —No visibility into user activation or engagement
- —No onboarding funnel or drop-off analysis
- —No trial-to-paid conversion tracking
- —30+ custom events sitting unused in PostHog
After
- —Clean data with Internal Users cohort filtering
- —66% inactive trial users identified — activation crisis surfaced
- —Full onboarding funnel with 70% drop-off point identified
- —580 paused users identified as re-engagement opportunity
- —34-chart dashboard covering the full user lifecycle
Methodology
Audit First, Build Second
The entire engagement was delivered in three weeks, following a deliberate sequence:
Week 1
Data Audit
17-chart audit dashboard mapping every event, property, and data source. Surfaced ~20% data pollution and created the Internal Users cohort.
Week 2
Paid Acquisition
Connected 4 ad platforms, configured 6 conversion APIs, built the paid acquisition dashboard with cross-platform funnels.
Week 3
Product Analytics
34-chart full-funnel dashboard with engagement segmentation, onboarding analysis, monetisation tracking, and retention metrics.
Want results like these?
I help product teams turn their analytics into decisions — not just dashboards. Book a free call and let's talk about your data.